Beat-finding using Fourier transform
Beat-finding using Fourier transform#
Finding a best-describing underlying beat in a sequence can be done using Fourier transforms, where we decompose a signal into its frequency components.
Using thebeat this is a piece of cake. We use the thebeat.stats.fft_plot() function to plot the Fourier transform. On the x axis will be the number of cycles per ‘unit’. The unit size depends on the time unit used when creating the Sequence objects. If you used seconds, the unit size is 1. If you used milliseconds, the unit size is 1000.
We create an example sequence, and initiate a random number generator with a seed, so you will get the same output as we:
[3]:
from thebeat import Sequence
import numpy as np

rng = np.random.default_rng(seed=123)

seq = Sequence.generate_random_normal(n_events=100, mu=500, sigma=25, rng=rng)
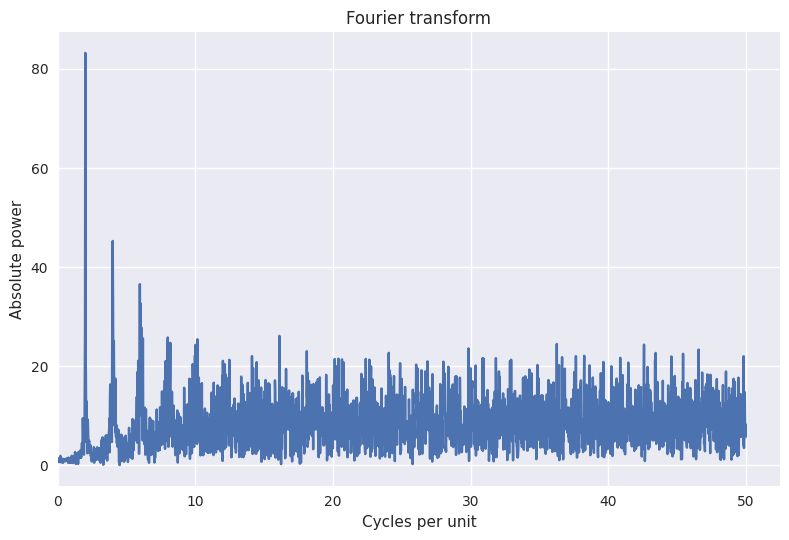
Now we plot the Fourier transform. Because we created our Sequence object using millisecond values, we will choose a unit size of 1000.
[4]:
from thebeat.stats import fft_plot

fft_plot(seq, unit_size=1000);
To investigate the plot in more detail, we can limit the x axis, which will help:
[5]:
fft_plot(seq, unit_size=1000, x_max=10);
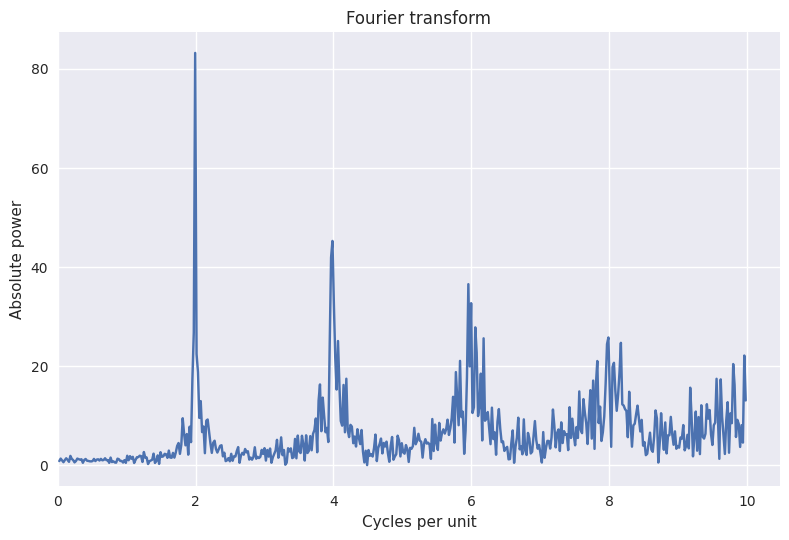
We see a very clear peak at around 2 cycles per second, i.e. every 500 ms.
If we want to know the exact number of cycles per unit of the peak, we can extract the data from the plot, find the position (index) of the largest y value, and get the corresponding x value of that y value. We then convert the value to an IOI in milliseconds.
[6]:
# Create the plot
fig, ax = fft_plot(seq, unit_size=1000, x_max=10)

# Get the data
x_data, y_data = ax.lines[0].get_data()

# Get the index of the highest value for y, and get its corresponding x value
max_y_index = np.argmax(y_data)
max_x = x_data[max_y_index]
print(1000 / max_x)
501.8585858585858
